Show code
install.packages(c("mongolstats", "mongolmaps"))Population is the denominator behind almost every public-health rate, and where people live decides where clinics, schools and services are needed. This post maps how Mongolia’s population shifted between 2015 and 2025, using two R packages I maintain:
Update, October 25, 2026: Both packages are now on CRAN. The latest mongolmaps release is 0.2.0; the analysis below was run with 0.1.0, as recorded in the session information.
install.packages(c("mongolstats", "mongolmaps"))library(mongolstats)
library(mongolmaps)
library(dplyr)
library(tidyr)
library(ggplot2)
library(scales)The NSO publishes mid-year resident population for every aimag, soum, bag and khoroo in a single table, DT_NSO_0300_002V4. One call fetches 2015 and 2025 for every unit:
tbl <- "DT_NSO_0300_002V4"
regions <- nso_dim_values(tbl, "Region")$code

pop <- nso_data(
  tbl,
  selections = list(Region = regions, Year = c("2015", "2025")),
  labels = "en"
)

pop_wide <- pop |>
  select(Region, year = Year_en, value) |>
  pivot_wider(names_from = year, values_from = value, names_prefix = "pop_") |>
  mutate(change = pop_2025 / pop_2015 - 1)

national <- filter(pop_wide, Region == "0")
Mongolia’s population grew from 2,964,085 to 3,437,000, a 16.0% increase. The NSO table mixes every level in one Region column, from the national total down to bags. mn_join() recognises the NSO codes, keeps only the level you ask for, and attaches the boundaries:
soums <- mn_join(pop_wide, by = "Region", level = "soum")

n_declined <- sum(soums$change < 0)National growth hides a split. Of Mongolia’s 339 soums and Ulaanbaatar districts, 135 (40%) had fewer residents in 2025 than in 2015.
p <- mn_map(soums, fill = change, title = "Population change by soum, 2015 to 2025") +
  scale_fill_gradient2(
    name = NULL, low = "#a6611a", mid = "#f5f5f5", high = "#018571",
    midpoint = 0, limits = c(-0.4, 0.4), oob = squish,
    labels = label_percent(style_positive = "plus")
  )
p + labs(caption = paste0(p$labels$caption, "\nPopulation: NSO Mongolia, DT_NSO_0300_002V4"))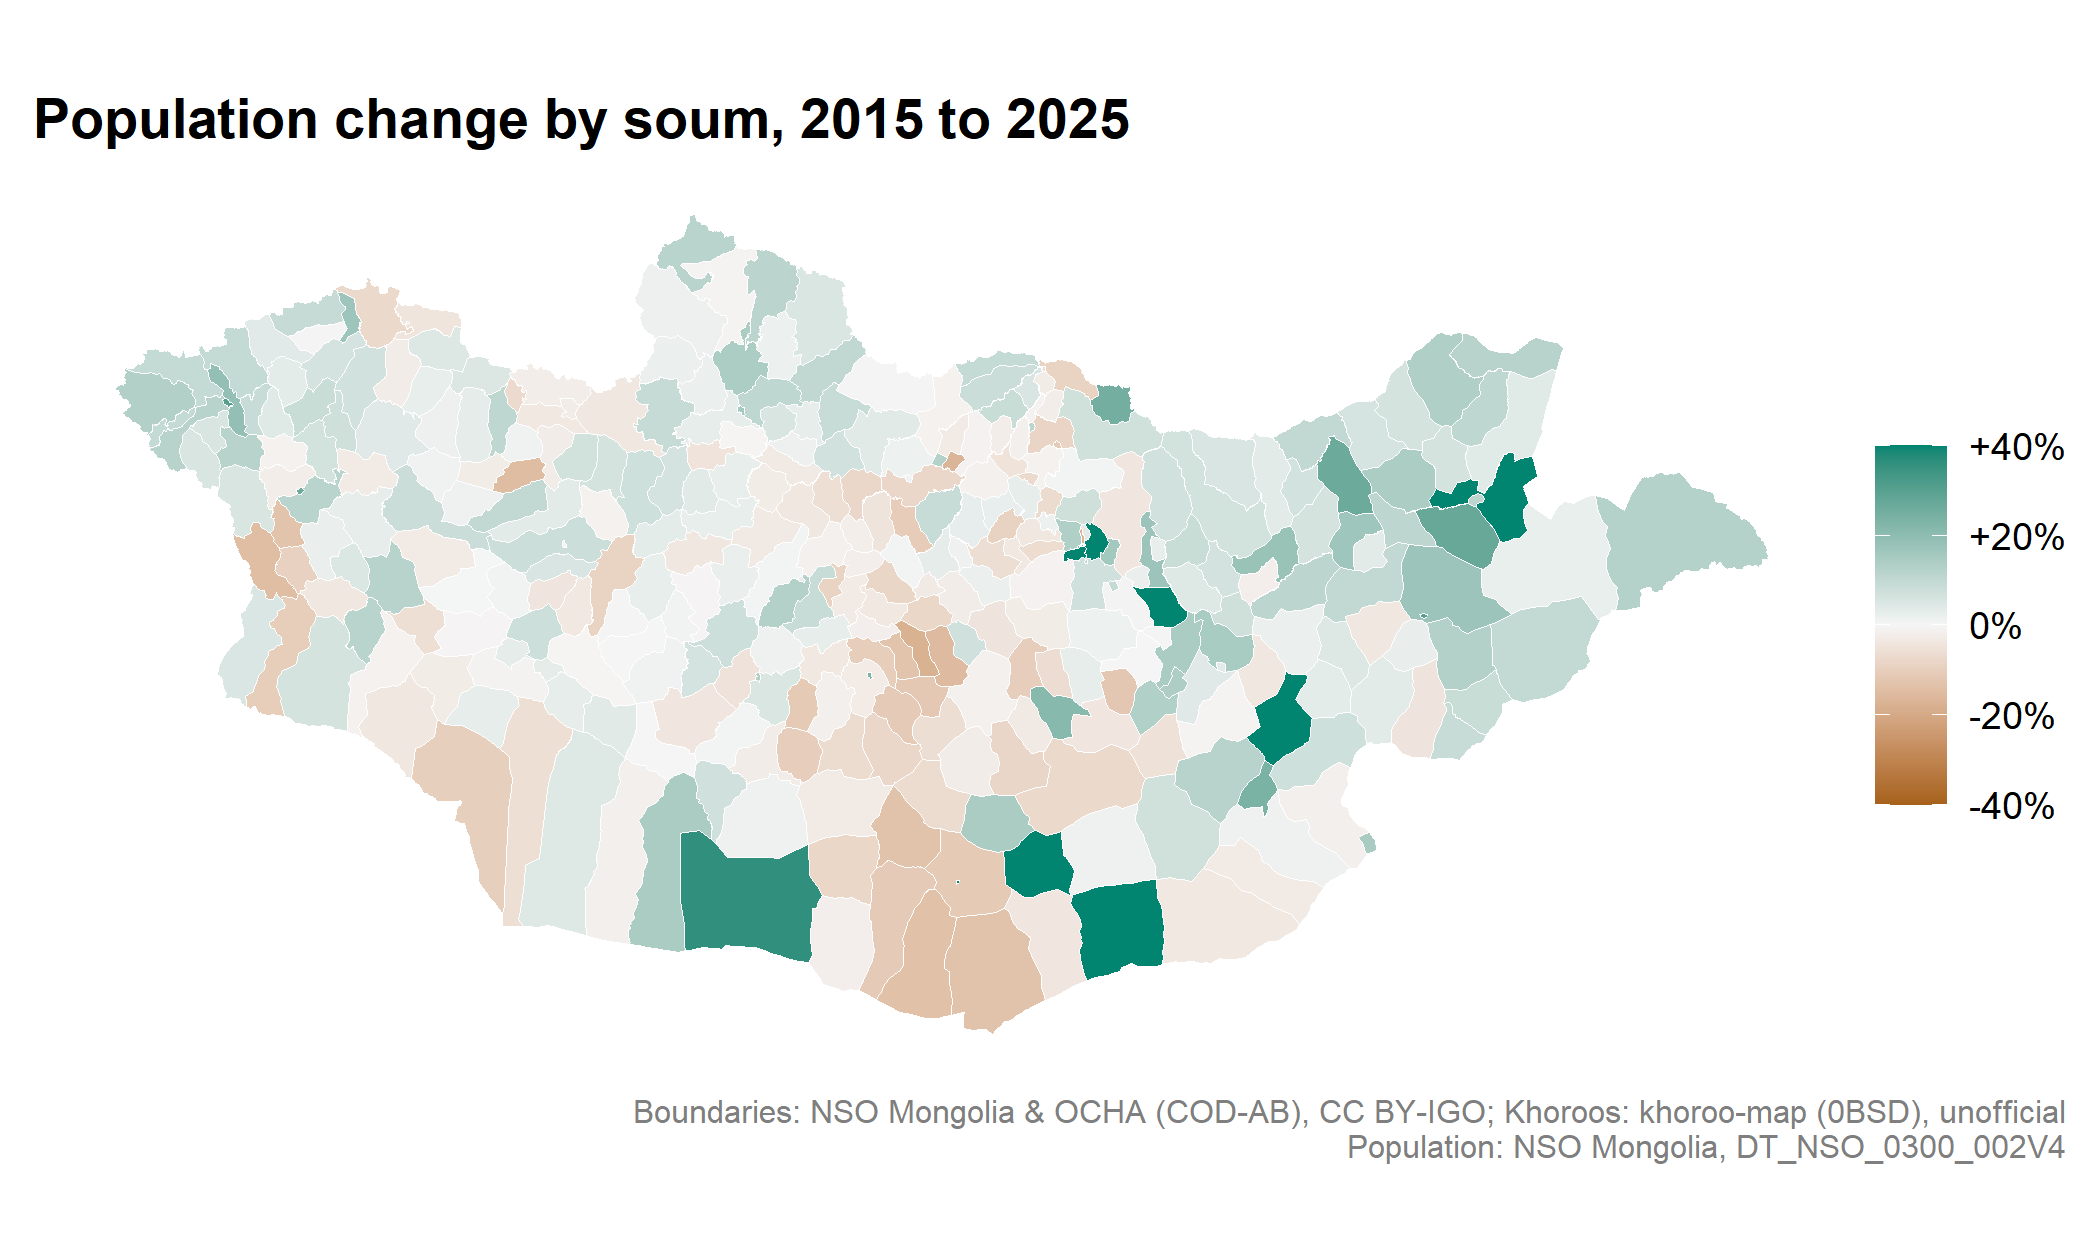
Declines cluster in the central and southern soums of the Khangai and Gobi, while most of the far west, north and east grew modestly. The strongest growth is in Umnugovi in the south: Khanbogd and Tsogttsetsii, home to the Oyu Tolgoi and Tavan Tolgoi mines, and the aimag centre Dalanzadgad. No soum lost more than a fifth of its residents, but a handful grew by more than 40%; the colour scale is capped there, so they share the darkest shade. Ulaanbaatar’s districts are too small to see at this scale.
Summed by aimag, the pattern is clearer:
aimags <- mn_join(pop_wide, by = "Region", level = "aimag") |>
  sf::st_drop_geometry()

ggplot(aimags, aes(change, reorder(name, change))) +
  geom_vline(xintercept = national$change, linetype = "dashed", colour = "grey50") +
  geom_vline(xintercept = 0, colour = "grey80") +
  geom_point(aes(colour = change > national$change), size = 2.5, show.legend = FALSE) +
  annotate("text", x = national$change, y = 1.5, hjust = -0.05, size = 3,
           label = "National average", colour = "grey40") +
  scale_x_continuous(labels = label_percent(style_positive = "plus")) +
  scale_colour_manual(values = c(`TRUE` = "#018571", `FALSE` = "grey45")) +
  labs(x = "Population change, 2015 to 2025", y = NULL,
       caption = "Source: NSO Mongolia, DT_NSO_0300_002V4") +
  theme_minimal(base_size = 11) +
  theme(panel.grid.minor = element_blank(), panel.grid.major.y = element_blank())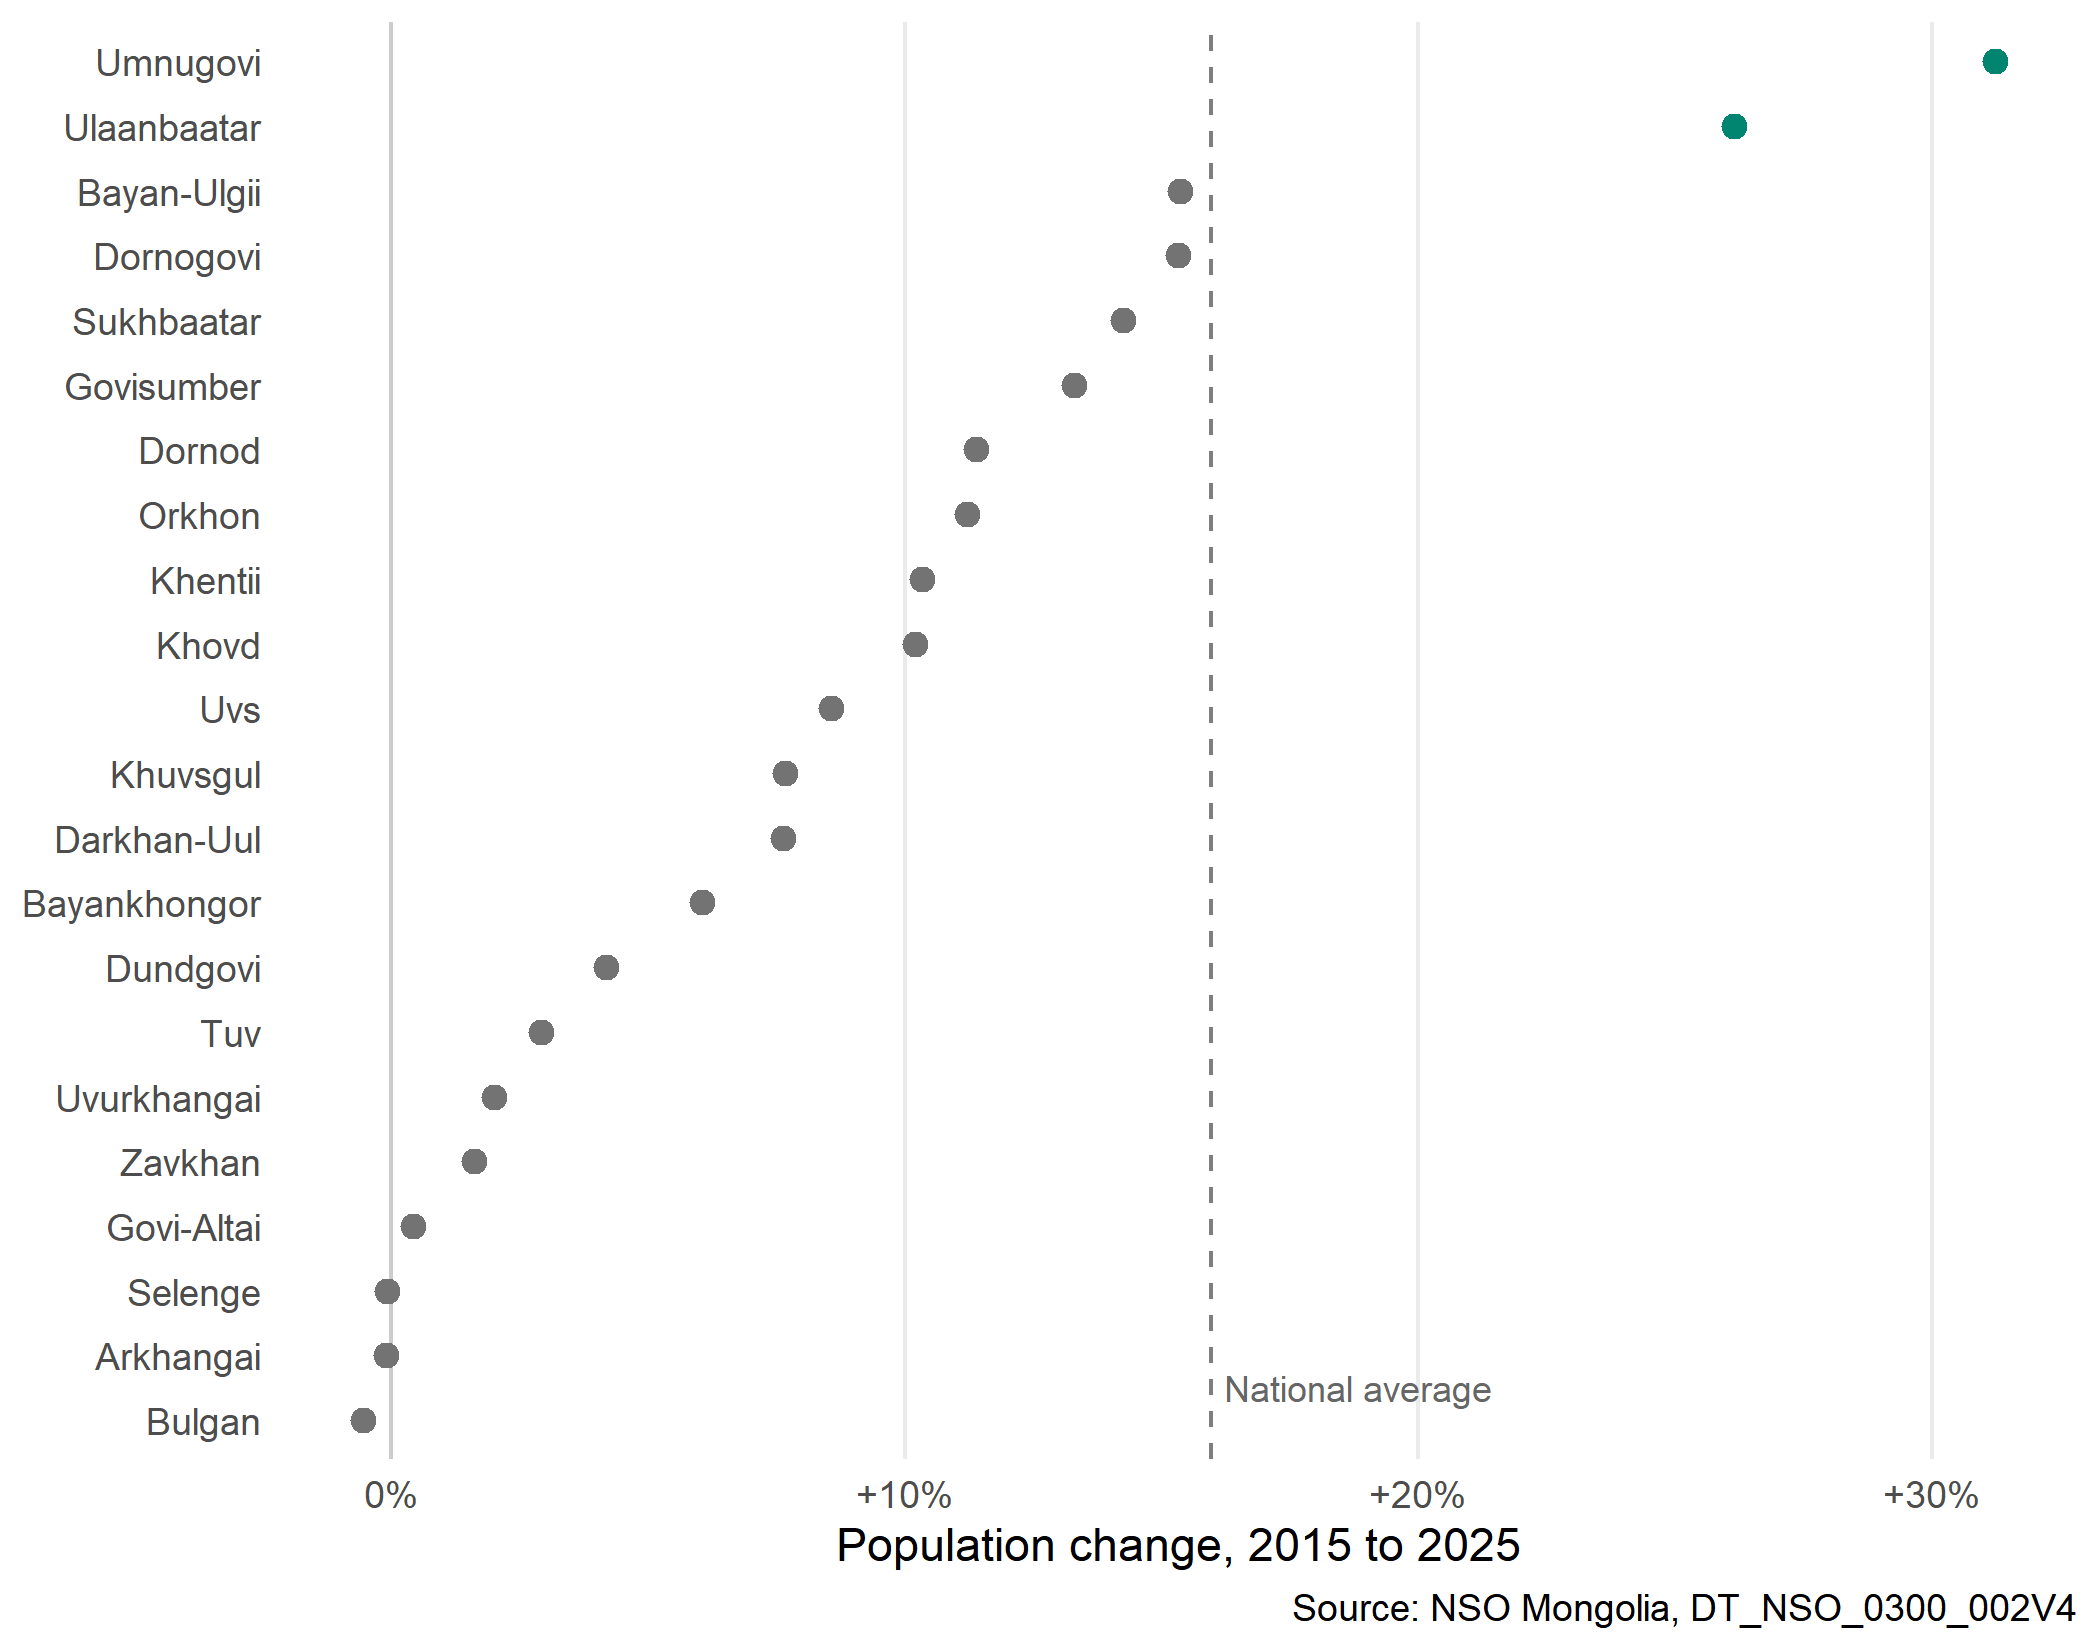
Only Umnugovi and Ulaanbaatar grew faster than the country as a whole. Every other aimag grew more slowly, and Selenge, Arkhangai and Bulgan were essentially unchanged. Because Ulaanbaatar was already home to almost half the country, 74% of the national increase landed in the capital.
Many of Ulaanbaatar’s khoroos were split or redrawn after 2015, so khoroo populations can’t be compared fairly over time. The 2025 figures show something else worth knowing: how unevenly people are spread across the six central districts.
central <- c("BGD", "BZD", "ChD", "KhUD", "SKhD", "SBD")

khoroos <- mn_join(pop_wide, by = "Region", level = "bag", within = central) |>
  mutate(density = pop_2025 / area_km2) |>
  arrange(desc(density)) |>
  mutate(
    pop_share = cumsum(pop_2025) / sum(pop_2025),
    half = lag(pop_share, default = 0) < 0.5
  )

dense <- filter(khoroos, half)
area_share <- sum(dense$area_km2) / sum(khoroos$area_km2)
Ranked by density, the 90 most crowded of the 189 khoroos hold half of the central districts’ 1,603,387 residents, on 1.2% of their land.
mn_map(
  mutate(khoroos, group = if_else(half, "Densest khoroos holding half of residents", "Other khoroos")),
  fill = group,
  title = "Half of central Ulaanbaatar lives here"
) +
  scale_fill_manual(name = NULL, values = c("#018571", "grey88")) +
  theme(legend.position = "bottom")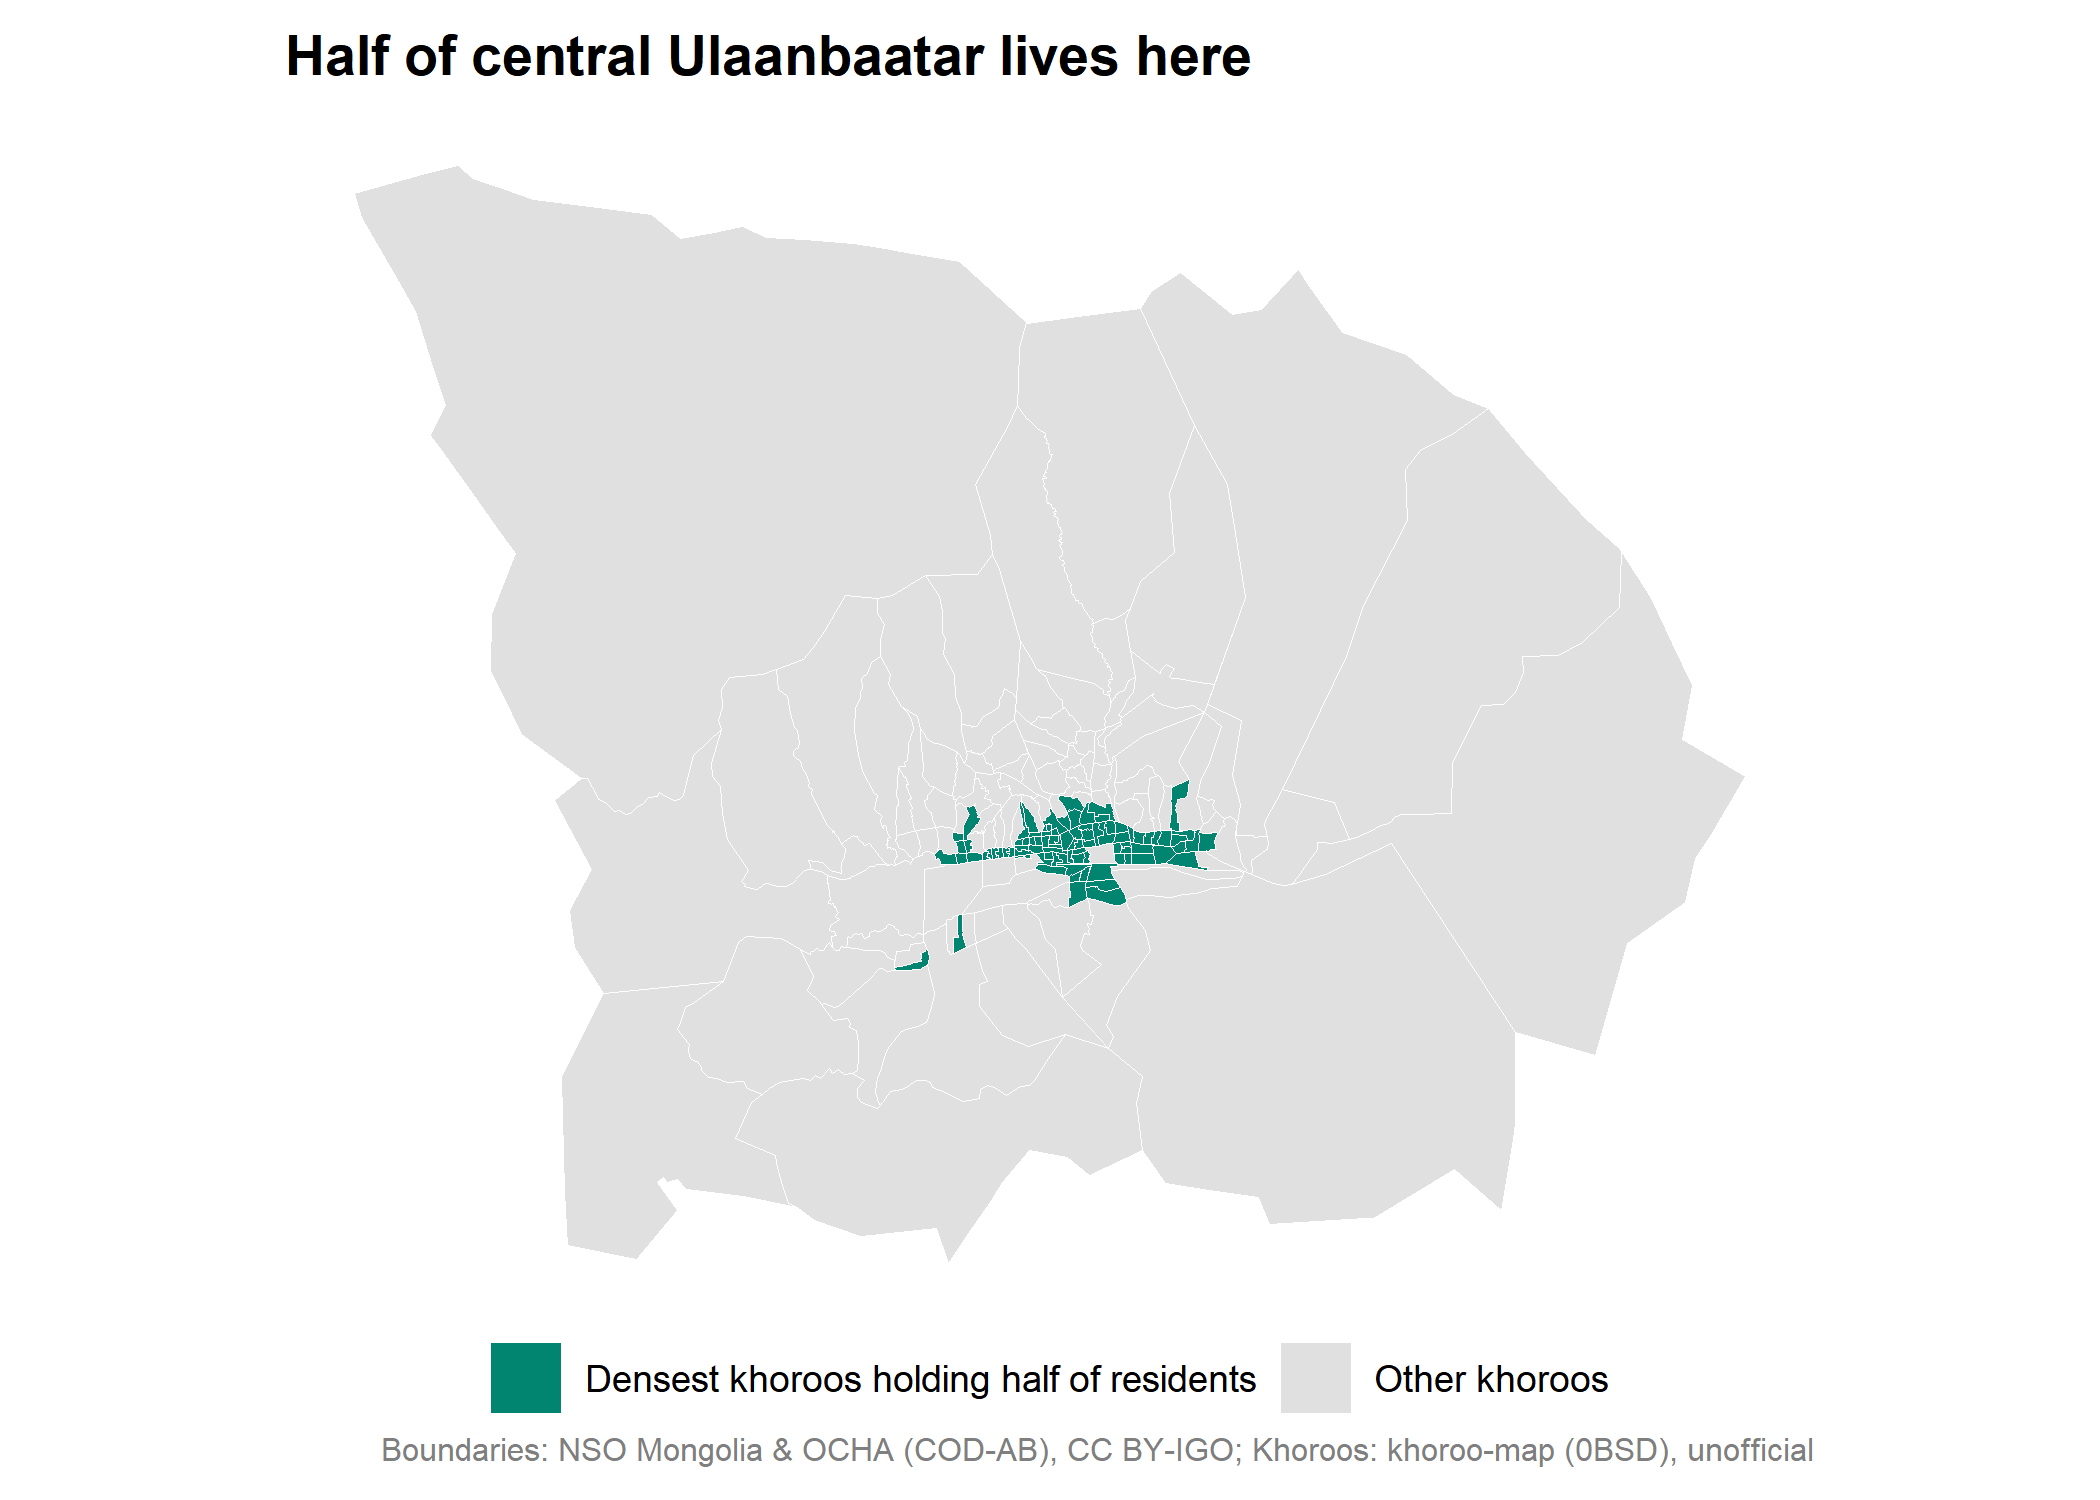
For health planning, that matters in both directions. Services in the dense core reach many people within a short distance, while the outer khoroos and the many shrinking rural soums need ways of reaching people that don’t depend on density.
sessionInfo()
#> R version 4.6.1 (2026-06-24 ucrt)
#> Platform: x86_64-w64-mingw32/x64
#> Running under: Windows 11 x64 (build 26300)
#>
#> Matrix products: default
#>   LAPACK version 3.12.1
#>
#> locale:
#> [1] LC_COLLATE=English_Canada.utf8  LC_CTYPE=English_Canada.utf8
#> [3] LC_MONETARY=English_Canada.utf8 LC_NUMERIC=C
#> [5] LC_TIME=English_Canada.utf8
#>
#> time zone: America/Vancouver
#> tzcode source: internal
#>
#> attached base packages:
#> [1] stats     graphics  grDevices utils     datasets  methods   base
#>
#> other attached packages:
#> [1] scales_1.4.0      ggplot2_4.0.3     tidyr_1.3.2       dplyr_1.2.1
#> [5] mongolmaps_0.1.0  mongolstats_0.2.0
#>
#> loaded via a namespace (and not attached):
#>  [1] gtable_0.3.6       jsonlite_2.0.0     compiler_4.6.1     Rcpp_1.1.2
#>  [5] tidyselect_1.2.1   yaml_2.3.12        fastmap_1.2.0      R6_2.6.1
#>  [9] labeling_0.4.3     generics_0.1.4     classInt_0.4-11    curl_7.1.0
#> [13] httr2_1.3.0        sf_1.1-2           knitr_1.51         htmlwidgets_1.6.4
#> [17] tibble_3.3.1       units_1.0-1        DBI_1.3.0          pillar_1.11.1
#> [21] RColorBrewer_1.1-3 rlang_1.3.0        stringi_1.8.7      xfun_0.60
#> [25] S7_0.2.2           otel_0.2.0         viridisLite_0.4.3  cli_3.6.6
#> [29] withr_3.0.3        magrittr_2.0.5     class_7.3-24       digest_0.6.39
#> [33] grid_4.6.1         lifecycle_1.0.5    vctrs_0.7.3        KernSmooth_2.23-26
#> [37] proxy_0.4-29       evaluate_1.0.5     glue_1.8.1         farver_2.1.2
#> [41] e1071_1.7-17       rmarkdown_2.31     purrr_1.2.2        tools_4.6.1
#> [45] pkgconfig_2.0.3    htmltools_0.5.9